Wednesday, May 29, 2013

Review: Penetration Testing with Backtrack (PWB) / Offensive Security Certified Professional (OSCP)

I recently took the PWB course, and finally passed the OSCP exam (and I'm very happy now :))))))), that's why I was quite for long time.

This was one of the best training and certification I have ever taken. I knew before I have started that it will be very hard and time consuming, but it was even more than I expected. First, I’m not really experienced on this subject, I made the EC-Council’s CEH course before this, but that was mainly theory and very little practice. Having a C|EH did help, as the whole stuff was familiar (in theory!), and didn’t need to start from scratch.

The training itself starts with receiving about 350 page long study material (lab guide) and about 7 hours video. These are covering all the basics you need for the later lab exercises. They start with how to setup services in BT (Backtrack), what is and how to do port scanning, various service enumeration, information gathering in general. Then it moves forward for writing buffer overflow exploits, it goes through all the steps in very detailed manner. After that they teach you how to work with public exploits, basics of Metasploit framework and there are two client side exploit case studies as well. The next big subject is transferring files between machines (there are some really tricky ones), tunneling, pivoting, and password attacks. Finally they cover basics of SQL injection and XSS attacks. There are a few other smaller topics, but they are not really part of the exercises later. There are quite a few exercises for each module to practice the techniques, which all have to be documented and sent along  the exam report at the end, but will talk about it later.

The big part is the remote lab. There is a big network with about 50 machines, and they try to simulate an existing organization with that. There are firewalls, proxy servers, machines are communicating with each other, so it’s pretty good. The big goal here is to attack all the machines and get root / admin access to all (or as many as you can/want to). I managed to own 46 machines. There are some very easy ones, and there are some which are really hard to get. My last and most difficult was “sufference” (you can have a guess, why the name is…), where I spent about 20-30 hours to get root on it; it was very-very tricky, and painful (oh, there is another box called “pain” – guess why :)). The training material teach you the basics, but you will have to go and learn a lot by your own, read about various services, OSes, application, and so on… because of the subject they just can’t cover everything, and this is really not the goal there, but to teach you to adapt and solve unknown problems, as you would face in real life. Will you spend hours in trying exploiting patched services, or other stuff, which won’t work? YES! Will you do it over and over again? YES! Will you hit your head to the desk, when you finally realize how to get in somewhere, and how stupid you were not seeing the forest because of the tree? Probably YES! :) All these part of the fun :) You can chat with the Offsec guys on IRC, but never expect them to give you a solution to any of the machines, if you go to them with some specific question, they may give you a hint, but that’s the maximum you can expect. Will you feel many times that you just can’t exploit a machine? YES! Will you get in later? Hopefully YES! I think their “Try Harder!” philosophy really works. Remember that all the machines are exploitable, and they are there to be exploited. All the boxes are different and almost all of them can be owned by different technique, so you can practice every type of attack, normal exploits, SQL injection, XSS attacks, client side exploits and so on. There are 4 networks in the lab separated by firewalls, proxy servers, as you would have in real life. You can practice various tunneling techniques there, and hopping from one machine to the next in the exploitation. I think if you are not a pentester, then you should get all of the machines in the lab, to get most out of the course. The lab time can be purchased for 30, 60 and 90 days, but if you feel it short, you can always extend it, as I did it (I went for 90 days + 30 days extension). I did the training after works and weekends, and I’m just lucky that my wife didn’t kill me for that :)

The exam. Obviously I can’t share details about it, but it’s a 24 hour long challenge, where you get access to another small network with a few machines, and similarly to the lab you need to get admin / root access on them. I really liked it, finally an exam, which not simple a lists of multi choice questions, but you really need to present your skills in practice, on a previously unknown environment (like on a Cisco CCIE). This is why it’s important to own all machines in the lab, to get prepared to the challenge, and face as many different systems as you can. Obviously you can use everything, as you could in a real world pentesting, but don’t expect the exam to be easy because of that. It’s hard. I started at 4PM (GMT+1), and progressed quite good, and at 1AM I already had enough points that I knew I will pass. So I went for a 6 hour sleep, and continued at 8AM, and quickly get my next machine. I decided to have a shower and breakfast then, and after that in another hour I completed everything. With that sad, it’s very important to take frequent breaks during the exam, as they can make huge difference; go and breathe some fresh air, your brain really needs oxygen :). I also prepared a list of commands I found very useful during the lab time, which became very handy during the exam.

The last part is to write the penetration test report about the exam, along with your recommendation how to fix the holes you have found. You have another 24 hours for that after the exam ends, so take notes, screenshots, etc… You need to make the same report for the lab network penetration testing and for the additional exercises you did during the training.

You get the results in 3 business days, but for me it was much quicker.

Overall I really enjoyed both the training and the exam, and I can’t say how much I learned during the last 4 months about this subject. It’s really worth its price, and much cheaper than any other similar training, you just need a lot of time, and even more time (I spent about 160-200 hours practicing in the lab after work and on weekends) – and most importantly a wife / girlfriend / family who will support you, and understand that you are not always available during this period :)

Links:

Friday, March 1, 2013

Computer Forensic Investigation w/ Backtrack

I took all my forensics related blog entries and created a single document from it, which can be downloaded from here:

Computer Forensic Investigation with Backtrack.pdf

I hope you will enjoy it.

Friday, February 8, 2013

Cisco releases EIGRP as an RFC

Cisco announced that they are releasing the basic EIGRP to the IETF as an Informational RFC. I think this is very welcome, and probably they realized that people are moving away from this protocol if they want to work on a multivendor environment, and Cisco just can't keep it for themselves.

On the other hand they also say that: "Advanced features of EIGRP, such as EIGRP stub, needed for DMVPN and large-scale campus deployment, will not be released to the IETF." Are they serious???  First, I wouldn't call the stub feature as advanced, in my experience you must have it, if you want to run EIGRP on a mid size (30 - 50 devices) environment cause otherwise it's just not scalable, even with implemented summarization and stub features, you can start to get stuck in actives from time to time on this size, causing hard time to network operators.

So with this release I don't expect organization starting to migrate to it, at least I wouldn't do it. I think w/o the stub feature you can only deploy it in small size environment, where usually there are no multiple vendors. While the direction is good, they should release all the features.

Cisco Q&A:
http://www.cisco.com/en/US/prod/collateral/iosswrel/ps6537/ps6554/ps6599/ps6630/qa_C67-726299.html

Sunday, February 3, 2013

Backtrack Forensics: PTK

Menu: Forensics -> Forensic Suites
Directory: various
Official Website: http://ptk.dflabs.com/
License: BSD type (?)

The PTK is an alternative to the Autopsy forensic framework. It has two editions, one is free, and the other is not. BT includes the free version.

Once we click on starting it, we get a webpage to configure it. The root password for the MySQL database is "toor", if you haven't changed it.


After that the configuration is complete.


On the next window we can apply for our free activation code.


And that's how far I could get. I haven't received the activation code yet.

Saturday, February 2, 2013

Backtrack Forensics: Digital Forensic Framework (DFF)

Menu: Forensics -> Forensic Suites
Directory: various
Official Website: http://www.digital-forensic.org/
License: GNU GLP v2

DFF is a free and open source forensic tool, which can perform the most common forensic tasks, like image and file system analysis, file carving, memory analysis, etc...

For the example here I picked up image #11 from http://dftt.sourceforge.net/test11/index.html
I used the GUI version, and once it's started, we can select "File -> Open evidence"


Once the image is added we will see its details on the right. In the middle we can right click on the image name, and select "Open with", which will do an analysis / task with one of the modules.


Here I choose "Search -> carvergui" which will do file carving on the disk, based on file header signatures. I selected everything, and hit "Start".


Once, it's done, the results will appear in the left tree, and we can browse through.


I played around with a few tools, but I think the other individual tools, for specific tasks, are much better then this. It's not bad, but there are better stuff.

Backtrack Forensics: The Sleuth Kit & Autopsy

Menu: Forensics -> Forensic Suites
Directory: various
Official Website: http://www.sleuthkit.org/
License: GNU GLP v2, and various, check website for more details

The Sleuth Kit is a collection of tools, which are created for analyzing disk images and file system data, the functionality can be extended with plugins. Autopsy is the graphical front end to the Sleuth Kit. As the set contains quite much tools, I will go over only some of the basics, and then have a look on Autopsy.

mmls can give us partition information (size, where it starts, end) and cluster size info.
mmls /dev/sdc


fls can print the file names found on a device.
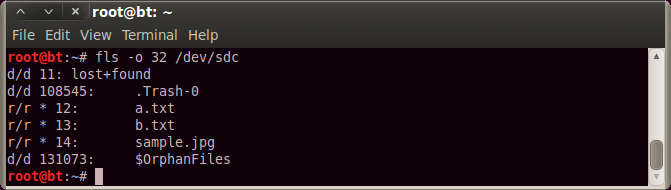
fls -o 32 /dev/sdc - will list only the root directory, -o sets the offset to the file system, which we know from the mmls output
fls -pr -o 32 /dev/sdc - prints full path, and all files recursively
fls -lpr -o 32 /dev/sdc - prints long information (time, etc...)


icat can print the contents of a file, we need to supply the inode number for that, what we know from fls.
icat -o 32 /dev/sdc 108546

Autopsy:
I will use the following test image for the demo: http://dftt.sourceforge.net/test7/index.html

First we need to select setup autopsy from the menu, to go through a few settings. After that we can start it from "/pentest/forensics/autopsy" with:
./autopsy

First we will get the following error:

conf.pl did not return a true value at /pentest/forensics/autopsy/lib//Main.pm line 62.
Compilation failed in require at ./autopsy line 56.
BEGIN failed--compilation aborted at ./autopsy line 56.

This can be fixed by entering setting "$LOCKDIR = '/tmp'" in the conf.pl file. After that it will start, and we can navigate in the browser to:

http://localhost:9999/autopsy

Autopsy works with the following structure:
Cases -> Hosts -> Images
So let's start with creating a case.


We can populate the case with some basic information:


Once we have a case, select "New Host" on the window, and we will get to here:


Once we have a host, we can add an image file.


Once we selected the image file (no browse function, we need to type the file path), on the next screen we can chose to calculate MD5 hash for the disk image. We can also see that it was recognized as a NTFS partition.


Once we added the image and clicked on the "Analyze" button, we can do several things. On the "Image details" we get general meta information from the image itself.


On the "Data Unit" we can enter a cluster, and it will print its content, we can chose to display it in ASCII, HEX or ASCII strings.


On the "File Analysis" menu, we can browse the file system, look for files, etc... if we click on a file, it will display its content in the frame below, and again we can chose the same view options.


On the "Meta Data" menu, we can enter the MFT entry number (which we can figure out from the previous place), and display meta information from a file.


Backtrack Forensics: Xplico

Menu: Forensics -> Network Forensics
Directory: /usr/local/bin/launchxplico.sh
Official Website: http://www.xplico.org/
License: GNU GLP v2 + Creative Commons Attribution-NonCommercial-ShareAlike 3.0 Unported

Xplico is an open source network forensic tool, which can extract various data from network traffic, it can either work from a capture file or do a capture itself. It can extract images, emails, web pages, VoIP streams, chat (MSN, IRC,...), telnet, ftp data, etc... It has a command line and a graphical interface. Let's see some basic usage:

I will use the graphical version, which we can start from the Backtrack menu. We get this:


We can go to the http://localhost:9876/ address, and can login from there.
The default users are:
admin/xplico - for administration, we can't do the normal work with this account.
xplico/xplico - for normal work. 
Once we logged in, we need to open a new case. We need to decide there if we will work from files or from live captures later. Both won't work in a single case.


Once we have a case, we can click on it, and thus start work.


In the case, we need to create sessions. where we can load the pcap files, or do the captures.


Once we have a session, we can enter to it.


Once we enter to a session, we can upload file at the right bottom corner, or if we have a live capture case, then start the capture there. On the left side we have the navigation bar, where we can select the various extracted information, and browse within them. At the middle, we have an overview, about how much items we have in each various data type.


Here is an example of images:


Here is a picture of the web URls found in the session.


That's all in short. I run a few captures, and the tool doesn't really find all of the images in a session. It might work better with other items.

Backtrack Forensics: tcpreplay suite

Menu: Forensics -> Network Forensics
Directory: /pentest/sniffers/tcpreplay
Official Website: http://tcpreplay.synfin.net/
License: GNU GLP v3

From the website: "Tcpreplay is a suite of tools written by  Aaron Turner for UNIX (and Win32 under Cygwin) operating systems which gives you the ability to use previously captured traffic in libpcap format to test a variety of network devices. It allows you to classify traffic as client or server, rewrite Layer 2, 3 and 4 headers and finally replay the traffic back onto the network and through other devices such as switches, routers, firewalls, NIDS and IPS's. Tcpreplay supports both single and dual NIC modes for testing both sniffing and inline devices."

The suite consists of the following tools:
tcpbridge - bridge two networks with tcprewrite
tcpprep - tool to use preprocess pcap files, and will create cache files, which will be used by tcpreplay or tcprewrite. It will classify packets as client -> server or server -> client.
tcprewrite - pcap editor to rewrite layer 2, 3 or 4 details
tcpreplay - replays packets to network
tcpreplay-edit - replays and edits pcap files to the network

not found in Backtract 5 R3:
"tcpliveplay - Replays network traffic stored in a pcap file on live networks using new TCP connections
tcpcapinfo - raw pcap file decoder and debugger"

Basically we can capture a traffic between a client and server, and replay it anywhere in the network. For actually testing a network, we will need to run tcpreplay in two locations, in the server and in the client side, where the client side will replay packets of the original client, and the server the other part. The MAC address, IP addresses and port numbers can be changed, thus this way we can create the same flow anywhere in the network, and check how the different locations behave.

To simply replay all packets from a capture:
./tcpreplay --intf1=eth0 test.pcap


A good article about testing Cisco WAAS with tcpreplay:

Backtrack Forensics: tcpflow

Menu: Forensics -> Network Forensics
Directory: /usr/local/bin/tcpflow
Official Website: https://github.com/simsong/tcpflow
License: GNU GLP v2+

"tcpflow is a program that captures data transmitted as part of TCP connections (flows), and stores the data in a way that is convenient for protocol analysis and debugging. Each TCP flow is stored in its own file. Thus, the typical TCP flow will be stored in two files, one for each direction. tcpflow can also process stored 'tcpdump' packet flows."

In Backtrack 5 R3 the installed version is 1.2.7, and it has a bug, that will terminate the program as soon as it started, see details here:
https://github.com/simsong/tcpflow/issues/3

So we need to upgrade it:
apt-get install tcpflow
at the time of this writing, the new version is 1.3.0. You can check it with:
tcpflow -V

Let's see an example:
tcpflow -p -i eth0 tcp port http
Here I filter the capture to HTTP ports (80) only, and set the interface not to be in promiscuous mode (-p). I visited "www.google.com", and it created 6 flows, 3 pairs (1-1 for each direction). It supports the same filtering options as tcpdump.


The flow files actually contains the extracted data from the TCP sessions, so we won't see packet headers, etc...


We can read sessions from a pcap file (-r), specify output directory (-o) other than the default, which is the current, turn on verbose mode (-v), or print the output only to the console (-c) instead of files.
I think it does a pretty good job with extracting content from TCP flows.

The tool can't handle IP fragments, and in that case it happens the reconstruction of a flow will not be correct.